Unifying Log Management: A Guide to Ingesting, Storing, and Visualizing Logs from Various Applications

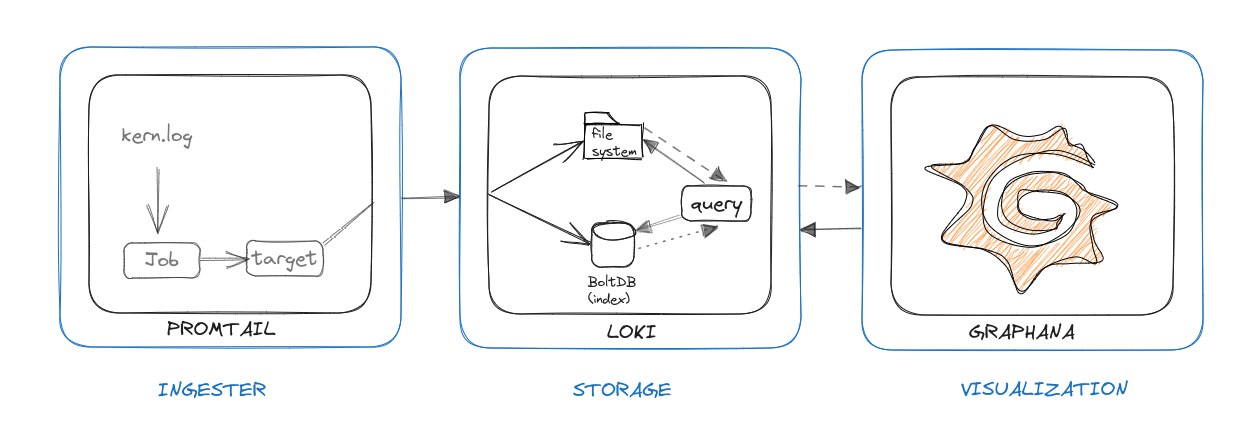
The guide will be concise, so I won't delve too deep. There are three key components to log management that you need to know about.
Data Ingestion: The process of collecting and capturing logs from various applications into a single location is essential for efficient log management. This is where Promtail comes into play—a powerful and flexible tool that enables effective log scraping. Promtail searches for and sends logs to a centralized system for processing and storage.
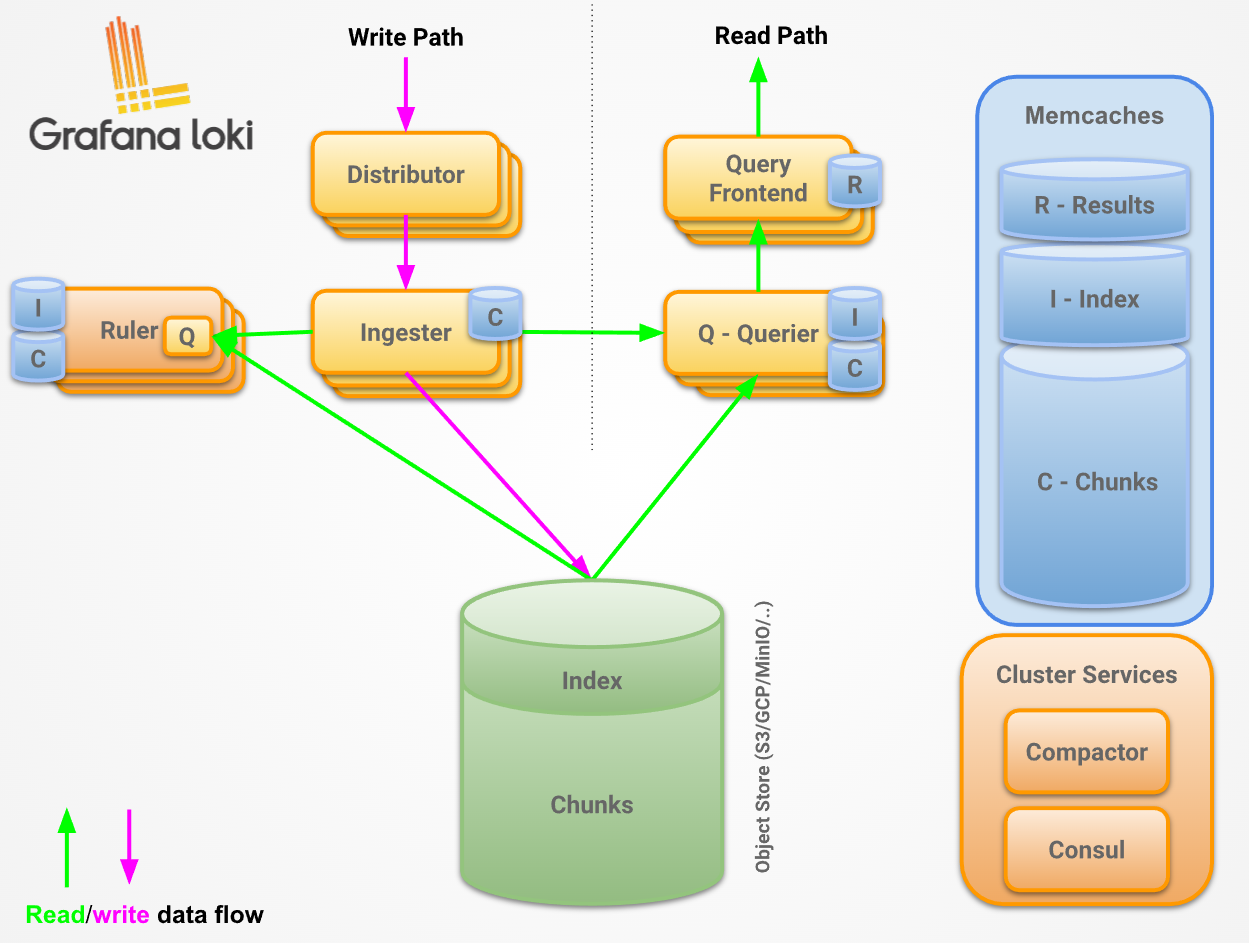
Log Storage: Once the logs are collected, you need a reliable and efficient place to store them. In this case, we use Loki, a high-performance log storage solution. Loki is specifically designed to handle large volumes of logs and offers exceptional scalability. Using a label-based approach, Loki organizes and searches logs, making management and subsequent analysis easier.
Visualization Tool: With the logs stored in Loki, you need a way to visualize and analyze them effectively. This is where Grafana comes in—a leading data visualization and monitoring platform. Grafana seamlessly integrates with Loki, allowing you to create customized dashboards, interactive graphs, and alerts based on log data. With Grafana, you can have a clear, real-time view of what's happening in your applications.
In this case, we have chosen Promtail, Loki, and Grafana as our tools for log management. However, it's important to note that there are many other options available in the market. The fundamental concept of ingesting, storing, and visualizing logs applies regardless of the specific tools you choose. You can tailor this guide to your own needs and select the tools that best fit your requirements.

Steps
Create docker compose file
    version: "3.8"

    services:

    grafana:

    image: grafana/grafana:latest

    hostname: 'grafana'

    volumes:

    - /home/byli-server/nfs/volumes/grafana:/var/lib/grafana

    ports:

    - "3003:3000"

    networks:

    - logs

    promtail:

    image: grafana/promtail:latest

    command:

    - '-config.file=/etc/promtail/promtail-config.yaml'

    volumes:

    - /home/byli-server/nfs/volumes/promtail/config/promtail.yaml:/etc/promtail/promtail-config.yaml

    - /var/log/kern.log:/var/log/kern.log:ro

    restart: always

    networks:

    - logs

    loki:

    image: grafana/loki:latest

    volumes:

    - /home/byli-server/nfs/volumes/loki/config/loki.yaml:/data

    command: -config.file=/etc/loki/local-config.yaml

    restart: always

    networks:

    - logs

    networks:

    logs:
Configure promtail
Create a configuration file /home/byli-server/nfs/volumes/promtail/config/promtail.yaml based on the Docker Compose. In this file, we need to include labels for the hostname or node (byli-server). Specifically, we will use the "kernlog" label to indicate that our client should send new events to Loki for kernel logs."
server:

http_listen_port: 9080

grpc_listen_port: 0

positions:

filename: /tmp/positions.yaml

clients:
  - url: http://loki:3100/loki/api/v1/push

pipeline_stages:
  - match:

selector: '{job="kernel-errors"}'

stages:
  - regex:

expression: "error|fail|panic"

scrape_configs:
  - job_name: kernel-errors

static_configs:
  - targets:

  - localhost

labels:

job: kernlog

host: byli-server

__path__: /var/log/kern.log
Configure Loki
Create a configuration file /home/byli-server/nfs/volumes/loki/config/loki.yaml based on the Docker Compose.
ingester: Configures the ingester of Loki.
lifecycler : Configures the lifecycle of the ingester.
ring: Configures the ring used by the ingester.
kvstore: Configures the storage for the ring.
store: boltdb: Uses BoltDB as the storage for the ring.
chunkidleperiod: Sets the idle period of chunks to 5 minutes.
chunkretainperiod: Sets the retain period of chunks to 30 seconds.
table_manager: Configures the settings of the table manager.
retentiondeletesenabled: true: Enables deletion of logs based on retention.
retention_period: 720h: Sets the retention period of logs to 720 hours.
These configurations specify that Loki uses BoltDB as the storage for the ingester's ring. The chunk idle period is set to 5 minutes, and the chunk retain period is set to 30 seconds. The table manager is enabled to delete logs based on retention, and the retention period for logs is set to 720 hours.
auth_enabled: false

server:

http_listen_port: 3100

grpc_listen_port: 9095

ingester:

lifecycler:

address: 127.0.0.1

ring:

kvstore:

store: inmemory

replication_factor: 1

chunk_idle_period: 5m

chunk_retain_period: 30s

schema_config:

configs:

- from: 2023-01-01

store: boltdb

object_store: filesystem

schema: v11

index:

prefix: index_

period: 24h

storage_config:

boltdb:

directory: /data/loki/index

filesystem:

directory: /data/loki/chunks

limits_config:

enforce_metric_name: false

reject_old_samples: true

reject_old_samples_max_age: 168h

chunk_store_config:

max_look_back_period: 0s

table_manager:

retention_deletes_enabled: true

retention_period: 720s
We appreciate your feedback and are glad to hear that the instructions provided were helpful in achieving the desired outcome. If you have any further questions or if there's anything else we can assist you with, please let us know. We're here to help.
